Creating reports of daily ticket trends with the Zendesk API
This tutorial shows you how to use the Zendesk API to create reports of daily ticket trends. Creating reports yourself gives you full control over the data they contain and the way the data is presented.
The simple report in this tutorial will contain the following data for the previous 30 days:
- The number of tickets created and solved each day
- The change to the ticket queue based on the number of tickets created and solved
What you need
You'll need an API token from a Zendesk account. The API token must be created by an admin in the Zendesk account to ensure the token has sufficient API permissions.
You also need to install Python and the following packages if you don't already have them:
- Python
- requests library for Python
- arrow library for Python
- python-dotenv library for Python
Setting your environment variables
Gather your Zendesk user email, API token, and Zendesk subdomain such as the string "mondocam" in "https://mondocam.zendesk.com".
To set the environment variables
-
In your project folder, create a text file named .env (with a leading period).
-
Use a text editor to paste the environment variables into the file:
ZENDESK_SUBDOMAIN=your_subdomainZENDESK_USER_EMAIL=your_email@example.comZENDESK_API_TOKEN=your_api_tokenNote that the values don't use quotes.
-
Save the updated .env file in your project folder.
-
If you're using GitHub for this project, add .env to your .gitignore file so it doesn't get pushed to the remote branch where others could access it.
Creating the ticket trends report
-
Create a folder called ticket_trends_reports on your system.
-
Copy and paste the following code into a file named ticket_trends.py.
import osimport sysimport csvimport requestsimport arrowfrom dotenv import load_dotenvREPORT_PERIOD = 30 # Number of days to analyze# load Zendesk credentialsload_dotenv() # reads variables from the .env file and sets them in os.environ# set global variablesBASE_URL = f"https://{os.environ['ZENDESK_SUBDOMAIN']}.zendesk.com"AUTH = f"{os.environ['ZENDESK_USER_EMAIL']}/token", os.environ['ZENDESK_API_TOKEN']def search(query):"""Searches for Zendesk records using the Search API and the Zendesk search reference athttps://support.zendesk.com/hc/en-us/articles/4408886879258"""results: list = []url = f"{BASE_URL}/api/v2/search.json"params = {'query': query,'per_page': 100}response = requests.get(url, auth=AUTH, params=params)while url:if response.status_code != 200:raise requests.HTTPError(f"{response.status_code}: {response.reason}")data = response.json()results.extend(data['results'])url = data['next_page']if url:response = requests.get(url, auth=AUTH)return resultsdef get_report_dates(days) -> list:report_dates = []today = arrow.now().floor('day')report_start_date = today.shift(days=-days)for i in range(days):date = report_start_date.shift(days=+i).format('YYYY-MM-DD')report_dates.append(date)return report_datesdef get_report_data(report_dates) -> list:rows = [('Date', 'Tickets created', 'Tickets solved', 'Change')]for date in report_dates:print(f"Getting ticket data for {date}")tickets_created = len(search(f"type:ticket created:{date}"))tickets_solved = len(search(f"type:ticket solved:{date}"))row = date, tickets_created, tickets_solved, (tickets_created - tickets_solved)rows.append(row)return rowsdef write_csv(file_name, rows) -> None:"""Writes rows to the specified csv file."""with open(file_name, mode='w', newline='', encoding='utf-8') as csv_file:report_writer = csv.writer(csv_file, dialect='excel')for row in rows:report_writer.writerow(row)print(f"Created {file_name}")returndef analyze_reopen_rate_and_details(tickets):"""Calculate reopen rate and generate detailed per-ticket info."""reopened_count = 0tickets_with_reopens = []total = len(tickets)for t in tickets:reopens = t.get('reopens', 0) # May need custom field or audit logsif reopens and reopens > 0:reopened_count += 1tickets_with_reopens.append({'Ticket ID': t['id'],'Subject': t.get('subject', ''),'Number of Reopens': reopens,'Last Status': t.get('status', ''),'Created': fmt(t.get('created_at')),'Updated': fmt(t.get('updated_at'))})reopen_rate = 100.0 * reopened_count / total if total else 0return reopen_rate, tickets_with_reopensdef analyze_channel_migration(tickets):"""Analyze how ticket submission channel mix changes over time."""channel_trend = defaultdict(lambda: Counter())for t in tickets:created_day = to_day(t['created_at'])channel = t.get('via', {}).get('channel', 'unknown')channel_trend[created_day][channel] += 1sorted_days = sorted(channel_trend)rows = []all_channels = {ch for chs in channel_trend.values() for ch in chs}all_channels = sorted(all_channels)for day in sorted_days:row = {'Date': day}for ch in all_channels:row[ch] = channel_trend[day].get(ch, 0)rows.append(row)return rows, all_channelsdef main():report_dates = get_report_dates(REPORT_PERIOD)report_data = get_report_data(report_dates)write_csv('ticket_trends.csv', report_data)# 3. Reopen rate and detailsreopen_rate, reopened_rows = analyze_reopen_rate_and_details(tickets)with open('reopened_tickets.csv', 'w', newline='', encoding='utf-8') as f:fieldnames = ['Ticket ID', 'Subject', 'Number of Reopens', 'Last Status', 'Created', 'Updated']writer = csv.DictWriter(f, fieldnames=fieldnames)writer.writeheader()for row in reopened_rows:writer.writerow(row)print(f"Reopen rate: {reopen_rate:.1f}%")print("Exported reopened tickets to reopened_tickets.csv")# 4. Channel migration trendchannel_rows, all_channels = analyze_channel_migration(tickets)with open('channel_migration_trends.csv', 'w', newline='', encoding='utf-8') as f:fieldnames = ['Date'] + all_channelswriter = csv.DictWriter(f, fieldnames=fieldnames)writer.writeheader()for row in channel_rows:writer.writerow(row)print("Exported channel migration trend to channel_migration_trends.csv")if __name__ == "__main__":main()
How it works
The Python script analyzes daily operational trends of Zendesk tickets. It does the following:
- Determines the number of tickets that were created and solved each day for the last 30 days.
- Calculates the change in the ticket queue each day by subtracking the number of ticket solved from the number of ticket created
- Exports the results to a CSV reports called ticket_trends.csv.
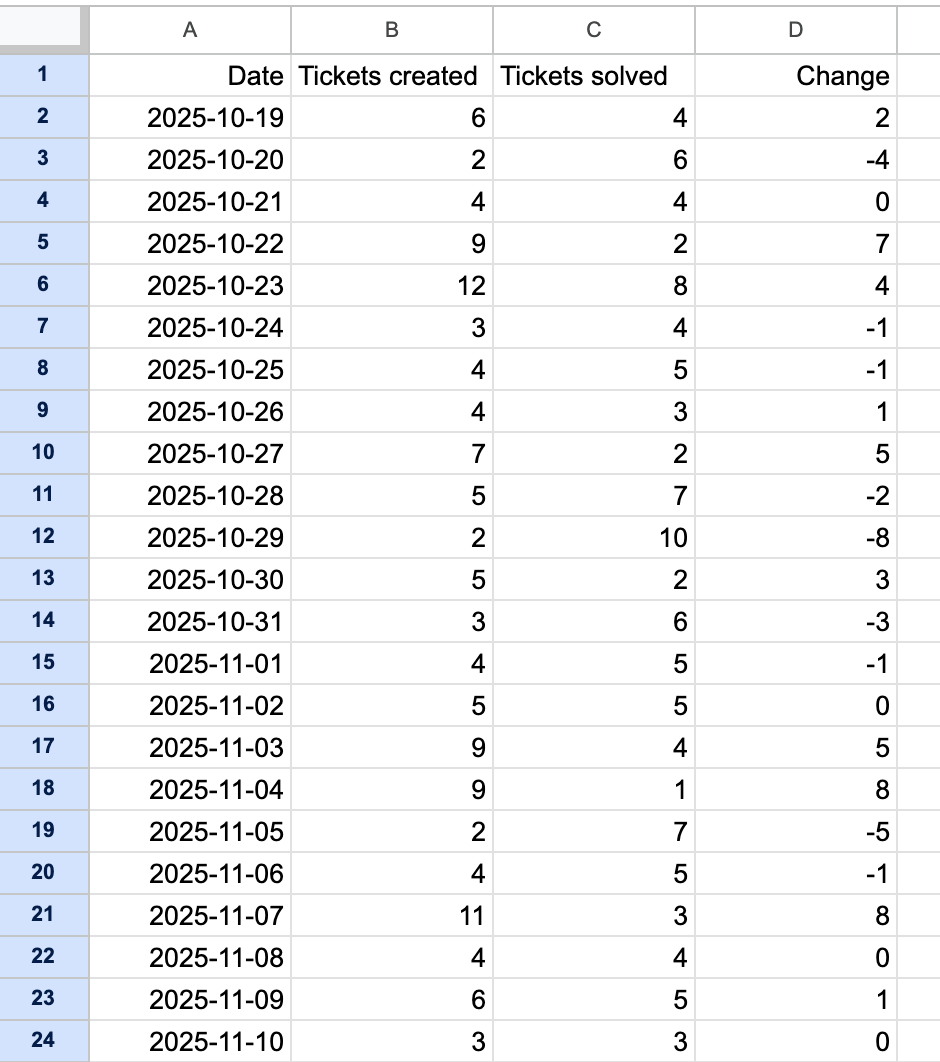
Example output
To run the script
-
In your terminal, navigate to your ticket_trends_reports folder.
-
Enter the following command and press Enter.
python3 ticket_trends.py
The data in the resulting ticket_trends.csv file will look similar to the following after importing it into your spreadsheet application:
You can use the data in the worksheet to perform additional calculations with your spreadsheet application. Examples:
- Calculating the daily mean number of tickets solved in the last 30 days
- Calculating the total increase or decrease to the ticket queue over the period
Running the report every month and comparing it with previous months will give you a long-term view of the baseline efficiency of your team.