Creating a ticket dashboard with the Search API
A ticket dashboard provides near real-time, highly specific insights into your support operations. Creating one yourself gives you full control over the data you present, the way it's visualized, and the platform where it's displayed.
This tutorial shows you how to create a web-based custom ticket dashboard that:
- polls the Zendesk Search API to fetch ticket data on a periodic basis
- shows the dashboard on an HTML web page
Steps covered in this tutorial:
- Previewing the dashboard
- What you need
- Creating the dashboard web application
- Creating the dashboard web page
- Running your completed dashboard
- Next steps
Previewing the dashboard
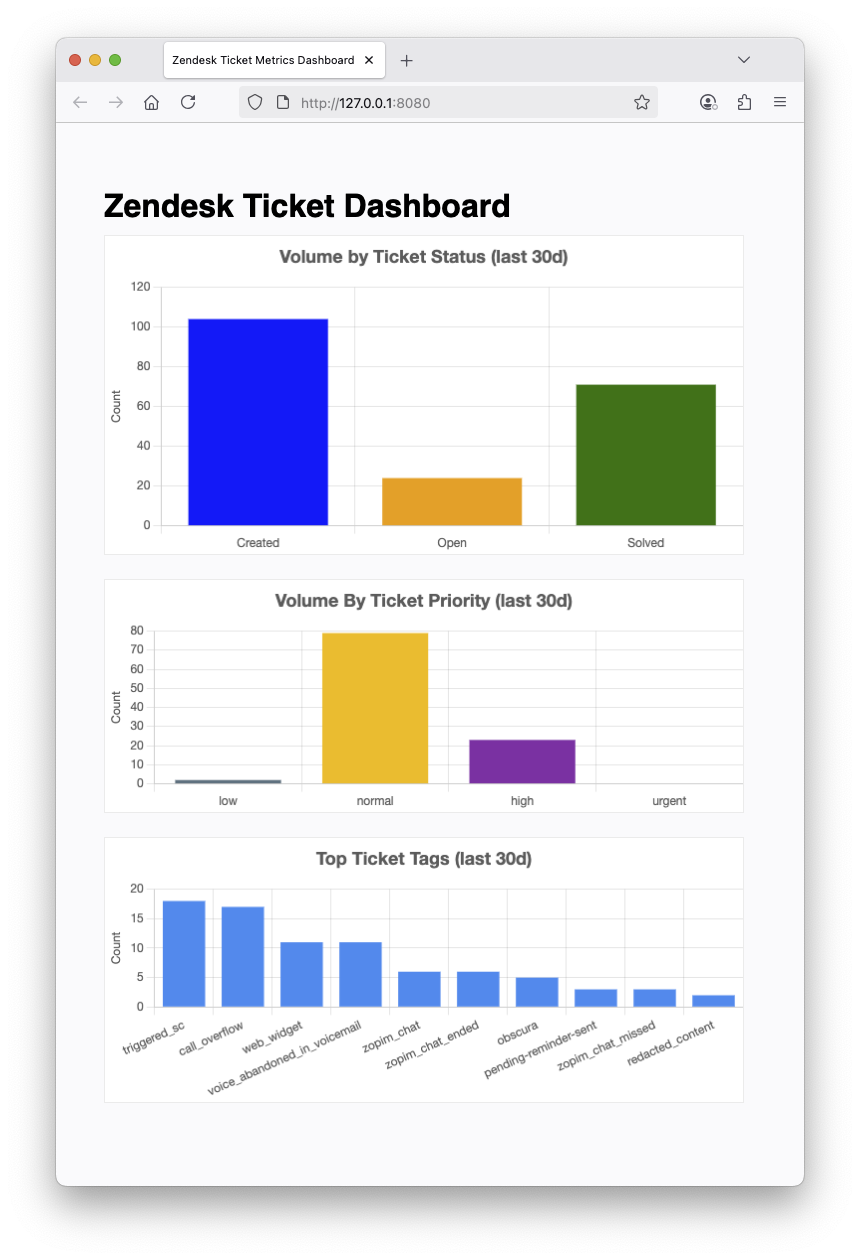
The tutorial keeps it simple for learning purposes. It shows you how to build a lightweight HTML dashboard that displays a few simple metrics that are updated automatically every 10 minutes.
Specifically, the dashboard shows the following information about tickets created in the last 30 days:
- the number of tickets by ticket status
- the number of tickets by ticket priority
- the most popular ticket tags and their totals
Here's a preview of the completed dashboard:
What you need
To complete this tutorial, you'll need the following:
- A Zendesk account with admin access. If you don't have an account, you can get a 14-day free trial.
- Python, an easy-to-use programming language
- Flask, a lightweight Python web application framework
- requests, a user-friendly Python library for making web requests
- arrow, a Python library that provides a human-friendly approach to working with dates, times, and timestamps
- os, a standard Python library for accessing environment variables (installed by default with Python)
- Environment variables set for
ZENDESK_API_TOKEN,ZENDESK_USER_EMAIL, andZENDESK_SUBDOMAINfor authentication
Creating the dashboard web application
This section shows you how to create a working web application with the Flask framework.
-
Create a new project folder and name it anything you like.
-
Inside the folder, create a text file named dashboard_app.py.
-
Paste the code that follows into the file.
Setting the environment variables
Set the environment variables set for ZENDESK_API_TOKEN, ZENDESK_USER_EMAIL, and ZENDESK_SUBDOMAIN. Be sure to export or set these environment variables before running the Python script.
MacOS or Linux (bash/zsh):
export ZENDESK_API_TOKEN="your_api_token"export ZENDESK_USER_EMAIL="[email protected]"export ZENDESK_SUBDOMAIN="your_subdomain"
Windows command prompt:
set ZENDESK_API_TOKEN=your_api_tokenset ZENDESK_USER_EMAIL=[email protected]set ZENDESK_SUBDOMAIN=your_subdomain
Windows PowerShell:
$env:ZENDESK_API_TOKEN="your_api_token"$env:ZENDESK_USER_EMAIL="[email protected]"$env:ZENDESK_SUBDOMAIN="your_subdomain"
dashboard_app.py
import loggingfrom collections import Counterfrom flask import Flask, render_template, jsonifyimport requestsimport arrowimport oslogging.basicConfig(format='%(asctime)s %(levelname)s %(message)s',level=logging.INFO)# In production, store your credentials in environment variablesZENDESK_API_TOKEN = os.getenv('ZENDESK_API_TOKEN')ZENDESK_USER_EMAIL = os.getenv('ZENDESK_USER_EMAIL')ZENDESK_SUBDOMAIN = os.getenv('ZENDESK_SUBDOMAIN')app = Flask(__name__)@app.route('/')def show_dashboard():"""Displays the dashboard HTML page in a browser."""return render_template('dashboard.html')@app.route("/api/ticket-metrics")def get_ticket_metrics():"""An API endpoint that returns the ticket metrics."""tickets = fetch_tickets()metrics = aggregate_metrics(tickets)return jsonify(metrics)def fetch_tickets() -> list:"""Returns the tickets created in the last 30 days."""tickets: list = []url = f'https://{ZENDESK_SUBDOMAIN}.zendesk.com/api/v2/search.json'start_time = arrow.utcnow().shift(days=-30)formatted_start_time = f"{start_time.format('YYYY-MM-DDTHH:mm:ss')}Z"query = f"type:ticket created>{formatted_start_time}"params = {'query': query,'sort_by': 'created_at','sort_order': 'desc','per_page': 100}auth = (f"{ZENDESK_USER_EMAIL}/token", ZENDESK_API_TOKEN)response = requests.get(url, auth=auth, params=params)while url:if response.status_code != 200:raise requests.HTTPError(f"{response.status_code}: {response.reason}")data = response.json()tickets.extend(data['results'])url = data['next_page']if url:response = requests.get(url, auth=auth)return ticketsdef aggregate_metrics(tickets) -> dict:"""Aggregates ticket data to create the following metrics:- the number of tickets created in the last period- of the tickets created, the number of open tickets- of the tickets created, the number of solved tickets- the distribution of the created tickets by priority setting- top tagsExample:{'created': 43,'open': 22,'solved': 21,'priority_distribution': {'low': 2, 'normal': 35, 'high': 6 },'top_tags': [('web_widget', 10), ('voice_abandoned_in_voicemail', 6), ('call_overflow', 4), ('pending-reminder-sent', 1)]}}"""# declare the variablestotal_created: int = len(tickets)total_open: int = 0total_solved: int = 0tags: list = []priorities: list = []# assign the ticket data to the variablesfor ticket in tickets:if ticket['status'] == 'open':total_open += 1if ticket['status'] == 'solved':total_solved += 1if ticket['tags']:tags.extend(ticket['tags'])if ticket['priority']:priorities.append(ticket['priority'])tag_counts: Counter = Counter(tags)priority_counts: Counter = Counter(priorities)return {'created': total_created,'open': total_open,'solved': total_solved,'priority_distribution': dict(priority_counts),'top_tags': tag_counts.most_common(10)}if __name__ == "__main__":app.run(port=5000, debug=True)
How it works
The dashboard_app.py file creates a Flask web application with two routes:
@app.route('/')is a base URL that returns the dashboard page (dashboard.html, which you'll create later in this tutorial)@app.route("/api/ticket-metrics")is an API endpoint that returns the ticket metrics. The dashboard will call this endpoint periodically to refresh its data.
The ticket metrics endpoint calls the fetch_tickets() function, followed by the aggregate_metrics() function, then returns the aggregated metrics in JSON format in the response:
@app.route("/api/ticket-metrics")def get_ticket_metrics():tickets = fetch_tickets()metrics = aggregate_metrics(tickets)return jsonify(metrics)
The fetch_tickets() function uses the Search API to get all the tickets created after a specific start time.
The Search API returns up to 1,000 results per query. If more than 1,000 tickets are created in your account per month, you can reduce the look-back period from 30 days to a shorter period such as 7 days: (arrow.utcnow().shift(days=-7)). Alternatively, you can use the Export Search Results endpoint to handle larger ticket volumes.
The aggregate_metrics() function processes the tickets to compute totals, counts by status, priority distribution, and tag frequency.
Creating the dashboard web page
This section shows you how to create an HTML dashboard page that displays the ticket metrics in charts.
Start by creating empty files for the dashboard's HTML, JavaScript, and CSS.
To create the HTML file
- In your project folder, create a folder named templates.
- In the templates folder, create a file named dashboard.html.
To create the JS and CSS files
- In your project folder, create a folder named static.
- In the static folder, create a file named script.js.
- In the static folder, create a file named styles.css.
The structure of your project folder should look as follows:
- dashboard_app.py- | templates- dashboard.html- | static- styles.css- script.js
Add the HTML
Open the templates/dashboard.html file in an editor and paste the following HTML into it:
<!DOCTYPE html><html lang="en"><head><meta charset="UTF-8" /><title>Zendesk Ticket Metrics Dashboard</title><script src="https://cdn.jsdelivr.net/npm/chart.js"></script><linkrel="stylesheet"href="{{ url_for('static', filename='styles.css') }}"/></head><body><h1>Zendesk Ticket Dashboard</h1><!-- dashboard has three charts: status, priority, tags --><div id="dashboard"><canvas id="ticket_status_chart" width="600" height="300"></canvas><canvas id="ticket_priority_chart" width="600" height="220"></canvas><canvas id="tags_chart" width="600" height="250"></canvas></div><script src="{{ url_for('static', filename='script.js') }}"></script></body></html>
How it works
The HTML file imports chart.js, an open source JavaScript charting library. See chartjs.org for more information.
The file also imports the styles.css and scripts.js files using the Jinja templating language used in Flask templates.
Add the JavaScript
Open the static/script.js file in an editor and paste the following script into it:
let ticketsChart, priorityChart, tagsChartfunction fetchMetrics() {fetch("/api/ticket-metrics").then(response => {if (!response.ok) {throw new Error("HTTP error! status: " + response.status)}return response.json()}).then(metrics => {renderCharts(metrics)}).catch(error => {console.error("Error fetching ticket metrics:", error)})}function renderCharts(metrics) {// Renders the dashboard's three charts.// render the ticket status chartlet ctx = document.getElementById("ticket_status_chart").getContext("2d")if (ticketsChart) {ticketsChart.destroy()}ticketsChart = new Chart(ctx, {type: "bar",data: {labels: ["Created", "Open", "Solved"],datasets: [{label: "By Status (last 30d)",data: [metrics.created, metrics.open, metrics.solved],backgroundColor: ["blue", "orange", "green"]}]},options: {plugins: {legend: { display: false },title: {display: true,text: "Volume by Ticket Status (last 30d)",font: { size: 18, weight: "bold" },padding: { top: 10, bottom: 20 }}},scales: {y: { beginAtZero: true, title: { display: true, text: "Count" } }}}})// render the ticket priority chartctx = document.getElementById("ticket_priority_chart").getContext("2d")if (priorityChart) {priorityChart.destroy()}priorityChart = new Chart(ctx, {type: "bar",data: {labels: ["low", "normal", "high", "urgent"],datasets: [{label: "By Priority (last 30d)",data: metrics.priority_distribution,backgroundColor: ["#9c27b0", "#607d8b", "#ffc107", "#e91e63"]}]},options: {plugins: {legend: { display: false },title: {display: true,text: "Volume By Ticket Priority (last 30d)",font: { size: 18, weight: "bold" },padding: { top: 10, bottom: 20 }}},scales: {y: { beginAtZero: true, title: { display: true, text: "Count" } }}}})// render the top tags chartctx = document.getElementById("tags_chart").getContext("2d")if (tagsChart) {tagsChart.destroy()}// calculate values for the `data.labels` and `data.datasets.data` propertiesconst top_tags = metrics.top_tagsconst labels = top_tags.map(item => item[0])const data = top_tags.map(item => item[1])tagsChart = new Chart(ctx, {type: "bar",data: {labels: labels,datasets: [{label: "Top Tags (last 30d)",data: data,backgroundColor: "#2196F3"}]},options: {plugins: {legend: { display: false },title: {display: true,text: "Top Ticket Tags (last 30d)",font: { size: 18, weight: "bold" },padding: { top: 10, bottom: 20 }}},scales: {y: { beginAtZero: true, title: { display: true, text: "Count" } }}}})}// set the API polling intervalconst pollingInterval = 10 * 60 * 1000 // 10 minutes in millisecondssetInterval(fetchMetrics, pollingInterval)// fetch the metrics when the page loadsdocument.addEventListener("DOMContentLoaded", () => {fetchMetrics()})
How it works
The script.js file consists of two custom functions:
fetchMetrics()make an HTTP request to the ticket metrics endpointrenderCharts()uses the Chart.js library to render the charts in the threecanvaselements in the dashboard.html file
The file also uses the native setInterval() function to poll the ticket metrics endpoint every 10 minutes:
const pollingInterval = 10 * 60 * 1000 // 10 minutes in millisecondssetInterval(fetchMetrics, pollingInterval)
Finally, the script calls the ticket metrics endpoint on page load:
document.addEventListener("DOMContentLoaded", () => {fetchMetrics()})
Add the CSS
Open the static/styles.css file in an editor and paste the following CSS into it:
body {font-family: sans-serif;padding: 40px;background: #fafbfc;}h1 {margin-bottom: 10px;}#dashboard {width: 640px;}button {margin-bottom: 18px;}canvas {background: #fff;border: 1px solid #eee;margin-bottom: 24px;}
Running your completed dashboard
To run the dashboard
-
In Terminal, navigate to your project folder.
-
Run the dashboard_app.py file as follows to start the web application in a local web server:
python3 dashboard_app.py -
Copy the page URL indicated in the start results and open it in your browser. The URL should be "http://127.0.0.1:5000".
If you leave the dashboard page open for another 10 minutes, the data should automatically refresh itself.
Next steps
You can change the polling interval (const pollingInterval = 10 * 60 * 1000; in script.js) or the period start time (start_time = arrow.utcnow().shift(days=-30) in dashboard_app.py). You can add other metrics to your dashboard and explore other Chart.js charting options to display them.
Currently your dashboard only runs locally on your system. You can make the dashboard available to your team by deploying the Flask application to a web server on your intranet or to a web hosting service.